How We Saved 12% in Resources with Smarter Heap Management

When we launched a new Scala service, we noticed memory issues as it gained usage. Key problems included:
- Memory usage increasing faster than expected, with some intermittent Out of Memory (OOM) errors
- Frequent garbage collection (GC) runs

To investigate, we took a heap dump using a free trial of this amazing tool called Jxray to analyze memory usage. Jxray revealed that we had underutilized buffers managed by the Netty framework, which was causing excessive memory usage.

Problem 1: Large Buffer Allocation in Netty
We found that our Play WS client (used for HTTP calls) relies on Netty through an older (shaded) version of AsyncHttpClient. This version of Netty was allocating large 16MB buffers by default, while newer versions use 4MB buffers.

To fix this, we followed Jxray’s advice and set the buffer size to 4MB using the system property:
-Dplay.shaded.ahc.io.netty.allocator.maxOrder=9
This change helped reduce memory consumption, saving over 250MB of heap

But our GC was still running too frequently, so we investigated further.
Problem 2: High GC Activity Due to Jsoniter Buffers
Using Datadog’s memory leak feature, we noticed that “Heap After Full GC” kept growing, meaning some objects in the heap’s Old generation weren’t being cleared.
In the JVM, the young generation is where new objects are allocated and collected quickly; it’s optimized for short-lived objects with frequent minor garbage collections. The old generation stores long-lived objects that survived multiple collections, with less frequent but more comprehensive major garbage collections.
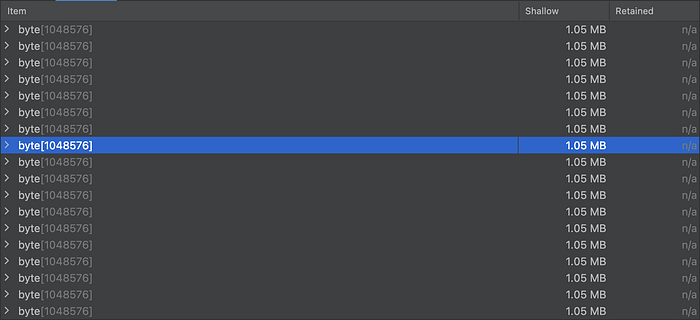
We traced this to a JSON library, Jsoniter, which uses a default 32KB buffer for serializing data. When handling larger data blobs, Jsoniter’s buffer had to expand (in powers of 2) to hold the data, creating a lot of temporary garbage and large “humongous objects.” (which we’ll explain in the next section) after which it had to shrink back to the default value of 32KB
For example, if we need to write data that’s 700KB, the buffer will have to expand from 32KB to 64KB, 128KB, 256KB, and 512KB to 1MB. Doing this will involve creating a new array each time, and copying over the data from the older array to the new array.
Humongous Objects and G1 Garbage Collection
With G1 GC, which is the garbage collector we were using, objects larger than half a region size (1MB in our 4GB RAM setup) are “humongous” and allocated in the Old generation, causing premature slow Full GCs, memory fragmentation, or unexpected out-of-memory conditions. Since our data could reach a max value of 800KB, Jsoniter’s buffer was frequently growing to 1MB, hitting this threshold and getting allocated in the Old generation, creating:
- Increased GC pause times
- Higher memory pressure
- Reduced application throughput
Solution: Pre-Set Buffer Size
To solve this, we set Jsoniter’s buffer size to 900KB, which met our data needs without needing frequent resizing. This change brought two benefits:
- Reduced garbage creation since resizing wasn’t needed.
- Smaller buffer size, which kept allocations in the Young generation, reducing memory pressure in the Old generation.
Results
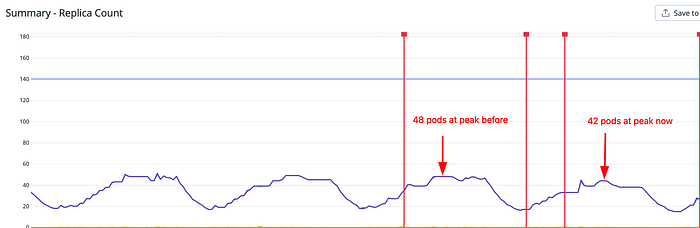
- This optimization reduced the number of pods by 12% meaning increased application throughput
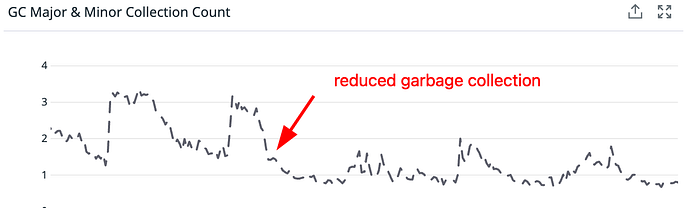
- We improved GC efficiency.
- We also saw a reduction in allocated memory:
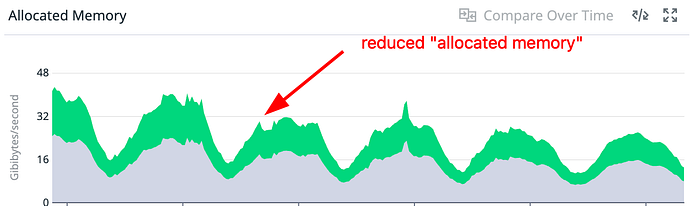
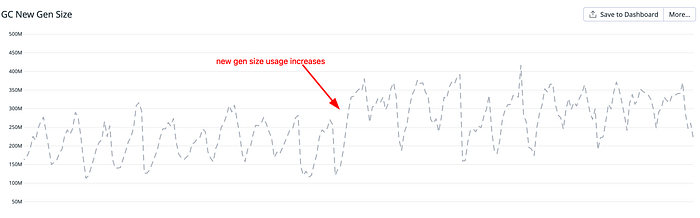
- We saw more objects allocated to the Young generation, leading to better memory management.
In summary, these changes made our service more memory-efficient, reduced resource consumption, and significantly improved performance.

